| Author | Thread |
|
|
11/10/2011 04:18:32 PM · #1 |

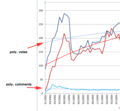
Interesting curve on Entries, Votes, and Comments.
I would like to hear what others think about what the chart tells us!
Scott
NOTE: Entries, votes, and comments are based on the monthly average per challenge during each month/year.
Message edited by author 2011-11-10 16:22:19.
|
|
|
|
11/10/2011 04:29:31 PM · #2 |
| For clarification, what is the difference between votes and poly. (votes)? I'm assuming one is the actual data point and the other is a curve fit to the data points? |
|
|
|
11/10/2011 04:42:44 PM · #3 |
Originally posted by gcoulson:
For clarification, what is the difference between votes and poly. (votes)? I'm assuming one is the actual data point and the other is a curve fit to the data points? |
A polynomial trend line is a statistical regression considered to be a special case of multiple linear regression. In simple terms, it shows you a smooth trend from 2002 to present. It is based on the same data.
Message edited by author 2011-11-10 16:48:02.
|
|
|
|
11/10/2011 04:54:55 PM · #4 |
| It tells me that, like the rest of the world, DPC is in a state of decline. ;-) |
|
|
|
11/10/2011 05:03:52 PM · #5 |
| In a couple years, when the number of entries hits the low single digits, I might be able to win a ribbon? |
|
|
|
11/10/2011 05:06:38 PM · #6 |
Surprised to see that challenges receive only about 25 comments on average. This really is a poor showing.
Also quite surprised by how quickly the number of participants per challenge is dropping with time. Wonder what is contributing to this effect?
Message edited by author 2011-11-10 17:09:32. |
|
|
|
11/10/2011 05:13:41 PM · #7 |
|
|
|
11/10/2011 05:18:54 PM · #8 |
Same chart but added reasons for spikes in entries.

|
|
|
|
11/10/2011 05:26:04 PM · #9 |
| I'm confused about the comments data. Is that average comments per challenge or per image/per challenge? Especially confusing as the polynomial trend in comments is much higher. But then I am not a statistician ;-) |
|
|
|
11/10/2011 06:19:47 PM · #10 |
Originally posted by MaryO:
I'm confused about the comments data. Is that average comments per challenge or per image/per challenge? Especially confusing as the polynomial trend in comments is much higher. But then I am not a statistician ;-) |
Entries: Average Entries per Challenge
Votes: Average # of Votes per Entry per Challenge
Comments: Average # of Comments per Entry per Challenge
Message edited by author 2011-11-10 18:26:31.
|
|
|
|
11/10/2011 06:37:23 PM · #11 |
Originally posted by MaryO:
Especially confusing as the polynomial trend in comments is much higher. |
I think you may be looking at the polynomial for votes, the comments poly is behind the comments, those two poly lines are a very similar colour.
Message edited by author 2011-11-10 18:44:45.
|
|
|
|
11/10/2011 07:11:40 PM · #12 |
Could it be that the top rated shots now are technically and creatively much advanced from what they were just a few years ago, partly due to the big improvements in software and equipment.
This tends to discourage some of the people who would enter challenges, just knowing that their entry, even with their best efforts would end up mid or lower. Personally, I have held back on entering some challenges, thinking "What's the use to put one out there just to see it get beat up in voting." Winning a challenge, or just scoring high in a virtual challenge is not enough to push me to become proficient in editing or to spend a lot of precious time going after a butt kicking shot so I can say "I did it."
It would be of interest to see how the challenges stack up in participation when sorted by the rule sets. The posted charts make a strong case for continuing the DPL thing.
|
|
|
|
11/10/2011 07:23:09 PM · #13 |
Originally posted by MelonMusketeer:
The posted charts make a strong case for continuing the DPL thing. |
While I'm a big fan of WPL/DPL (it's FUN!), I'm not sure the charts make that case. I think the charts show us that during league play there are, on average, more entries ion challenges, sure: but that represents increased participation by the same relatively limited, number of people. The charts don't tell us anything about how many discrete individuals are participation each month, and how many entries, on average, these individuals make. And I suspect that what we really need here is more people participating, not more entries-per-person, to be healthy and prosper.
I'm not sure about this, it's just my gut feeling.
R.
|
|
|
|
11/10/2011 07:36:40 PM · #14 |
| interesting that November is invariably a low participation month... wonder why that is? depressing weather? |
|
|
|
11/10/2011 07:39:42 PM · #15 |
Originally posted by LevT:
interesting that November is invariably a low participation month... wonder why that is? depressing weather? |
I suspect the worsening weather, noticably shorter days, and the long Thanksgiving holiday weekend (lots of travel and planning for same) may distract people a bit. |
|
|
|
11/10/2011 09:10:10 PM · #16 |
Originally posted by james_so:
Originally posted by MaryO:
Especially confusing as the polynomial trend in comments is much higher. |
I think you may be looking at the polynomial for votes, the comments poly is behind the comments, those two poly lines are a very similar colour.
|
You're right. Blue and cyan "poly" colors look pretty similar and I did confuse them.
Nevermind ::said in my best Emily Litella voice:: |
|
|
|
11/11/2011 02:56:28 AM · #17 |
Being the curious type, I'd like to see plot points on the timeline for the rules changes that where introduced by DPC.
Wouldn't the introduction of the second weekly challenge, (for registered members) have had an effect on the "totals" ?
|
|
|
|
11/11/2011 03:07:54 AM · #18 |
Originally posted by GeneralE:
Originally posted by LevT:
interesting that November is invariably a low participation month... wonder why that is? depressing weather? |
I suspect the worsening weather, noticably shorter days, and the long Thanksgiving holiday weekend (lots of travel and planning for same) may distract people a bit. |
Yup...heat, longer days and no public holidays with impending floods do make for less entries for some members!!!!
|
|
|
|
11/11/2011 04:39:19 AM · #19 |
Originally posted by SDW:
Originally posted by gcoulson:
For clarification, what is the difference between votes and poly. (votes)? I'm assuming one is the actual data point and the other is a curve fit to the data points? |
A polynomial trend line is a statistical regression considered to be a special case of multiple linear regression. In simple terms, it shows you a smooth trend from 2002 to present. It is based on the same data. |
I don't think it's an appropriate regression. It's fitting something you want to see in the data.
I think a moving average of about... 16 points would give a truer representation (16 is roughly the number of challenges per month, it wouldn't be zero-phased though).
Edit: Just noticed your point about monthly averages. In that case, I don't think you should fit a curve to the trend to be honest*.
Interesting image though.
* Unless you have a reason to justify the thought that participation in challenges follows a polynomial trend... you can't really say it is... You can fit any curve to any trend if you want. But that doesn't mean it's appropriate.
Message edited by author 2011-11-11 04:51:26.
|
|
|
|
11/11/2011 04:48:43 AM · #20 |
Also. Put this and this into the labels too if you can (birth and death of exclusive open challenges).
|
|
Home -
Challenges -
Community -
League -
Photos -
Cameras -
Lenses -
Learn -
Help -
Terms of Use -
Privacy -
Top ^
DPChallenge, and website content and design, Copyright © 2001-2025 Challenging Technologies, LLC.
All digital photo copyrights belong to the photographers and may not be used without permission.
Current Server Time: 08/18/2025 02:54:22 PM EDT.


