| Author | Thread |
|
|
03/20/2009 09:11:24 PM · #1 |
FWIW, I see the difference and I feel that the picture is not improved. Yes, it's a nice color for the dog, but I have no reason to believe that it's necessarily more accurate. Moreover, as is reflected in my comment, I believe that the unity of color throughout the image is an important part of the pic and has been removed in the edit.
It dramatically changes the nature of the pic and while it's another option, I would say that the first is significantly better.
Originally posted by jeger:
Okay.
Here is my quick edit.
1 - I converted the profile to sRGB. You should make sure your colour profile is sRGB because otherwise when you save for web, the colours will not be displayed the same.
2 - Noise Ninja to remove some of the noise.
3 - Adjustment Layer for Colour Balance ( -25 Cyan, +30 Blue)
I purposely left it a little warmer because I know that was the look you were going for.
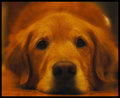 
What do you think? Can you see the difference? Do you think it's an improvement? |
|
|
|
|
03/20/2009 07:39:35 PM · #2 |
Originally posted by jhomrighaus:
What on earth do I make of this score distribution? |
Taste, but not yours. Your picture has neither good nor bad taste; it just is. Taste is represented by the votes. Good taste at one end, bad taste at the other, and no taste at all in the middle.
That should clear it up for you, and incidentally end all this gibberish about statistics. Glad to have been of service. |
|
|
|
03/20/2009 07:14:15 PM · #3 |
Originally posted by Bear_Music:
Originally posted by DrAchoo:
Basically you are saying that we would be dealing with two different populations of voters and that's why it would change. I'm saying that it is unlikely one could come up with the variable between the two populations when we get to numbers like 500 on an integral vote of 1-10.
But when we get to 250 to 500 voters, I cannot think of a variable that would set the two populations apart that would make a difference. |
Well, doc, it's always been my personal conviction that there's a hard-core, serious group of voters who work at rollover, and who are very analytical and thoughtful about how they approach images, and that they represent a much more "informed" subset of DPC, so to speak. Couldn't prove it, of course, but it's always felt that way to me :-)
R. |
Didn't you delete the sentences from my quote that said exactly that?
Message edited by author 2009-03-20 19:14:39. |
|
|
|
03/20/2009 06:51:24 PM · #4 |
Originally posted by DrAchoo:
Basically you are saying that we would be dealing with two different populations of voters and that's why it would change. I'm saying that it is unlikely one could come up with the variable between the two populations when we get to numbers like 500 on an integral vote of 1-10.
But when we get to 250 to 500 voters, I cannot think of a variable that would set the two populations apart that would make a difference. |
Well, doc, it's always been my personal conviction that there's a hard-core, serious group of voters who work at rollover, and who are very analytical and thoughtful about how they approach images, and that they represent a much more "informed" subset of DPC, so to speak. Couldn't prove it, of course, but it's always felt that way to me :-)
R.
|
|
|
|
03/20/2009 06:36:49 PM · #5 |
Originally posted by DrAchoo:
Basically you are saying that we would be dealing with two different populations of voters and that's why it would change. I'm saying that it is unlikely one could come up with the variable between the two populations when we get to numbers like 500 on an integral vote of 1-10. That being said, I think we can find small examples of what you are talking about. The voters that vote right at rollover are likely a different population than the average voter. They show up at 12:00 to see the rollover and likely have a vested interest in either the site or the challenge. They may very well vote differently than your regular voter.
But when we get to 250 to 500 voters, I cannot think of a variable that would set the two populations apart that would make a difference. |
Like I said...I am not saying that is the case...just an illustration. More precisely, I would say there are a lot more than just 2 populations. What I am saying is that as the voting progresses you start to move from one extreme population (those who are voting right at the rollover) towards the other extreme (the more "general population" voters). This can (but may not) have an effect that would increase the variance. The difference may be very small. But the point is I don't know, and I would be interested to see if such a thing occurs. I am less concerned of what the distribution is, but rather, I want to know how the distribution evolves. |
|
|
|
03/20/2009 06:25:30 PM · #6 |
Originally posted by mshimer5:
Originally posted by DrAchoo:
Your first paragraph is exactly how I see things pan out. Your second paragraph, to me, is possible but just speculation. I guess I'm trying to get at it backwards. Why would we expect such a result? If there are no reasons to suspect it, then it's unlikely it would be true. |
Very good question. I should state the reason for me even saying what I said. I was trying to illustrate that there is more than one way that a distribution can evolve. Also, I state this because in my training, I deal with distributions that aren't exactly intuitive. I usually try not to assume a certain evolution; but, instead try to use data/mathematics to rule out certain distributions.
Originally posted by DrAchoo:
If the first 500 voters present with a SD of X, why would we not assume the next 500 voters would have a similar SD? |
I can try to give you a possibility here but realize that this is speculation off the top of my head. I am not saying this is the case, but it could be possible. Imagine the first 500 votes come early on in the voting (say soon after voting opens up). Now most of these votes might come from a specific voting block (those who vote early). These could be those who are very active on the site. This block may have very similar voting habits (vote on a similar scale/philosophy). In this early voting the "random" votes would have little effect on the variance, so the variance may be smaller. Then as the voting continues, may be more and more less active members (or people who are more representative of the "general public") start to vote. These people may have a more broad background/voting habits/philosophy so then the random noise or this broad group start to have a large effect on the variance. This could start to broaden everything out.
I hope I was clear on what I was saying here, I am trying to stay away from technical talk :) The point is that variance can be time dependent. Again, this view comes from my training as I deal with time dependent distributions in my research. |
Basically you are saying that we would be dealing with two different populations of voters and that's why it would change. I'm saying that it is unlikely one could come up with the variable between the two populations when we get to numbers like 500 on an integral vote of 1-10. That being said, I think we can find small examples of what you are talking about. The voters that vote right at rollover are likely a different population than the average voter. They show up at 12:00 to see the rollover and likely have a vested interest in either the site or the challenge. They may very well vote differently than your regular voter.
But when we get to 250 to 500 voters, I cannot think of a variable that would set the two populations apart that would make a difference. |
|
|
|
03/20/2009 05:30:16 PM · #7 |
| I gave you a 4. I didn't comment it but i think i would give you a 5 now, because now i looked at the DOF with different eyes, and i kind of like it. What i think that really gave you low votes is this yellow/orange light that didn't convince me too. |
|
|
|
03/20/2009 04:43:05 PM · #8 |
Originally posted by DrAchoo:
Your first paragraph is exactly how I see things pan out. Your second paragraph, to me, is possible but just speculation. I guess I'm trying to get at it backwards. Why would we expect such a result? If there are no reasons to suspect it, then it's unlikely it would be true. |
Very good question. I should state the reason for me even saying what I said. I was trying to illustrate that there is more than one way that a distribution can evolve. Also, I state this because in my training, I deal with distributions that aren't exactly intuitive. I usually try not to assume a certain evolution; but, instead try to use data/mathematics to rule out certain distributions.
Originally posted by DrAchoo:
If the first 500 voters present with a SD of X, why would we not assume the next 500 voters would have a similar SD? |
I can try to give you a possibility here but realize that this is speculation off the top of my head. I am not saying this is the case, but it could be possible. Imagine the first 500 votes come early on in the voting (say soon after voting opens up). Now most of these votes might come from a specific voting block (those who vote early). These could be those who are very active on the site. This block may have very similar voting habits (vote on a similar scale/philosophy). In this early voting the "random" votes would have little effect on the variance, so the variance may be smaller. Then as the voting continues, may be more and more less active members (or people who are more representative of the "general public") start to vote. These people may have a more broad background/voting habits/philosophy so then the random noise or this broad group start to have a large effect on the variance. This could start to broaden everything out.
I hope I was clear on what I was saying here, I am trying to stay away from technical talk :) The point is that variance can be time dependent. Again, this view comes from my training as I deal with time dependent distributions in my research. |
|
|
|
03/20/2009 04:40:26 PM · #9 |
Originally posted by mshimer5:
I will try my best in prose here (realize that I may have to stray away from prose but I will try my best):
There are always people who will not fall into the "norm" and will give a vote that appears to be "Random". These votes have an effect of providing noise to your distribution. As you increase the number of votes these random votes become less important, leaving only trends behind. So if a trend does exist away from the "norm" this may become easier to see as it will survive as the random noise goes away. This could occur under very controversial pictures, etc. |
These "abnormal" voters do in fact exist, as I well know. They are *very few* in number, however. They often account for the votes that are clearly identifiable as outliers. I've never seen a case where skew, bimodality, or other severe non-normality was due to whacked-out voting styles. Doesn't mean none exist, I just haven't seen one.
Originally posted by mshimer5:
Now adding more votes may have another effect. It may, in fact, broaden everything out. I don't know what would happen. But I do believe that even 500 votes is not exactly a very large sample size, so attempting to find these trends would be very difficult. |
I think this is actually a very answerable question, it's just that the required data is hard to lay hands on. I'll throw out a few personal observations:
- Over the course of a week's voting, an image's score may tend to shift more than one would predict would happen by chance if all the votes were coming from a population with a fixed distribution. These changes seem to be limited, but are definitely a sign that "all is not Gaussian". Still, the end result is most often a damn good approximation of a Gaussian distribution, with perhaps a few outliers.
- I have not tested this, but I'd *bet* that some minor broadening does occur as voting progresses, due to the effect described above. We're talking a tenth of a point or two, and I'd bet that the effect on the variance might not even be detectable. A good test would be to track voting distributions for a number of images at various points in the voting process. We missed the boat, the "Hidden Gem" challenge was probably the ultimate opportunity to test this line of thinking.
- Consider this: voting distribution for a given image may be like the data for a multivariate experiment. The overall data set may not look entirely Gaussian, until the main effects and interactions are accounted for. In the case of voting, our challenge is to ferret out those effects. Not a small challenge. I've actually done ANOVA on a data set comprising all votes cast by all voters over several months (over a million votes) to assess a specific hypothesized effect on voting.
|
|
|
|
03/20/2009 04:33:41 PM · #10 |
Originally posted by wdamman:
Check some "Photographer Profiles" under the Community tab.
I found a number of them with "Avg Vote Cast" under 4. Most of the profiles I saw averaged 5 to 6. What votes are you handing out if your average is 3.7?
Maybe if their voting stats show on the profile page they would give more thought to their votes (or maybe not). There is plenty of room. |
Somebody explain to me what this has to with anything. Wait I get it. People should cherry pick 20% of the entries so your average looks good.
|
|
|
|
03/20/2009 04:14:49 PM · #11 |
Hi,
I didn't realise so many people had done an edit on this, I read the OPs post and just downloaded the pic then played about with it in PS, LOL now I see loads of others have already done it... Here's my take on how I would have possibly submitted this one had it been mine, dunno how it would have scored there's still tons of noise evident but it's about the best I could do :)

Message edited by author 2009-03-20 16:15:32.
|
|
|
|
03/20/2009 04:11:30 PM · #12 |
| Your first paragraph is exactly how I see things pan out. Your second paragraph, to me, is possible but just speculation. I guess I'm trying to get at it backwards. Why would we expect such a result? If there are no reasons to suspect it, then it's unlikely it would be true. If the first 500 voters present with a SD of X, why would we not assume the next 500 voters would have a similar SD? |
|
|
|
03/20/2009 03:38:26 PM · #13 |
Originally posted by DrAchoo:
Originally posted by mshimer5:
My question would be though if you increase the number of voters does the curve become more normal, or do the deviations become more pronounced. Saying this voting conforms to a normal distribution or that we should be able to apply the central limit is *not* trivial. That is all I have been saying. |
Look at it this way. Can you describe in prose (not statistics) why the deviations would become more pronounced? What scenario would this be true under? I can't think of a reason why a blip in the voting at one end (say 1 or 2 votes or 9 or 10 votes) would become MORE pronounced if you added on another 500 votes. |
I will try my best in prose here (realize that I may have to stray away from prose but I will try my best):
There are always people who will not fall into the "norm" and will give a vote that appears to be "Random". These votes have an effect of providing noise to your distribution. As you increase the number of votes these random votes become less important, leaving only trends behind. So if a trend does exist away from the "norm" this may become easier to see as it will survive as the random noise goes away. This could occur under very controversial pictures, etc.
Now adding more votes may have another effect. It may, in fact, broaden everything out. I don't know what would happen. But I do believe that even 500 votes is not exactly a very large sample size, so attempting to find these trends would be very difficult. |
|
|
|
03/20/2009 03:26:47 PM · #14 |
Originally posted by tnun:
From the author of The Black Swan:
"My major hobby is teasing people who take themselves & the quality of their knowledge too seriously & those who don�t have the courage to sometimes say: I don�t know...." (You may not be able to change the world but can at least get some entertainment & make a living out of the epistemic arrogance of the human race).
The point of the reference was, I believe, to shift the focus of the discussion so that we can return to appreciate the wonder of voting scores with reference to the wonder of the photos themselves.  posthumous was not picking a quarrel with the voting system, but simply suggesting a perspective within which to view statistical analysis. posthumous was not picking a quarrel with the voting system, but simply suggesting a perspective within which to view statistical analysis. |
that's right, and I was doing it with 3 drinks in me.
the significance of a change from 1-10 to 1-100 is that there is more room for variation in the voters' assumptions about what the scale itself means, as the dpc voting scale is notoriously undefined...
which is a good thing. who sez I wanted to change anything? hurmph, if i want to change something I'll just look at it differently. |
|
|
|
03/20/2009 03:26:04 PM · #15 |
Originally posted by mshimer5:
My question would be though if you increase the number of voters does the curve become more normal, or do the deviations become more pronounced. Saying this voting conforms to a normal distribution or that we should be able to apply the central limit is *not* trivial. That is all I have been saying. |
Look at it this way. Can you describe in prose (not statistics) why the deviations would become more pronounced? What scenario would this be true under? I can't think of a reason why a blip in the voting at one end (say 1 or 2 votes or 9 or 10 votes) would become MORE pronounced if you added on another 500 votes. |
|
|
|
03/20/2009 03:23:32 PM · #16 |
| That makes more sense to me. :) Thanks tnun. |
|
|
|
03/20/2009 03:08:03 PM · #17 |
From the author of The Black Swan:
"My major hobby is teasing people who take themselves & the quality of their knowledge too seriously & those who don’t have the courage to sometimes say: I don’t know...." (You may not be able to change the world but can at least get some entertainment & make a living out of the epistemic arrogance of the human race).
The point of the reference was, I believe, to shift the focus of the discussion so that we can return to appreciate the wonder of voting scores with reference to the wonder of the photos themselves. posthumous was not picking a quarrel with the voting system, but simply suggesting a perspective within which to view statistical analysis.
Message edited by author 2009-03-20 15:08:52. |
|
|
|
03/20/2009 02:59:21 PM · #18 |
Originally posted by DrAchoo:
I think if you remove the word "Gaussian" and replace it with either normal or bell shaped the argument becomes obvious. 99% of the voting that takes place on the pictures entered takes the rough shape of a bell curve (with truncation at times). The ones that don't, as Fritz pointed out, usually have an obvious reason (subject matter, etc) for their deviation. This is so reproducible, I would wager, that the reason Fritz was running those normal distributions on entries was to look for voter manipulation and that it can be found for this very reason.
I think Don's bringing up of The Black Swan has no bearing on a process in which 200-500 people vote on a picture. |
My question would be though if you increase the number of voters does the curve become more normal, or do the deviations become more pronounced. Saying this voting conforms to a normal distribution or that we should be able to apply the central limit is *not* trivial. That is all I have been saying.
Message edited by author 2009-03-20 15:00:43. |
|
|
|
03/20/2009 02:54:47 PM · #19 |
I think if you remove the word "Gaussian" and replace it with either normal or bell shaped the argument becomes obvious. 99% of the voting that takes place on the pictures entered takes the rough shape of a bell curve (with truncation at times). The ones that don't, as Fritz pointed out, usually have an obvious reason (subject matter, etc) for their deviation. This is so reproducible, I would wager, that the reason Fritz was running those normal distributions on entries was to look for voter manipulation and that it can be found for this very reason.
I think Don's bringing up of The Black Swan has no bearing on a process in which 200-500 people vote on a picture. |
|
|
|
03/20/2009 02:51:01 PM · #20 |
Originally posted by kirbic:
The biggest impediment to doing this type of work is that it is *very* difficult to collect the required statistics in an automated manner, and collecting them manually is too onerous for all but the smallest data sets |
I think you mean "data", not "statistics"?
R.
|
|
|
|
03/20/2009 02:42:41 PM · #21 |
Originally posted by mshimer5:
That is precisely why I am not too sure about the central limit here. If you look at the derivation of the central limit, it assumes some intrinsic mean with some finite variance. (yes, i know you don't *need* an intrinsic mean for central limit, but without it, the application is far less trivial) I do not believe there is any intrinsic mean. As you said, different groups will offer completely different distributions. I wager that when looked at at different times you also could get different distributions. Now, I admit I haven't collected any data on the subject, so I am only speculating. I would love to see how these trends evolve: i.e. how does the variance change as the number of votes increase? Is it constant or does it change (up or down)? |
Here's a thought with regard to the "intrinsic mean" idea... the mathematical center of the voting scale is 5.5, but we can't vote 5.5. If you ask people what the "center point" of the voting scale is (limited to available choices), you will, by far, get "5" as the answer. In fact, the global average for DPC votes is consistently somewhere between 5.0 and 5.5. So there is a case for an intrinsic mean, especially since the standard deviation of the overall voting curve for the vast majority of images is much greater than the uncertainty in our estimate of this hypothetical intrinsic mean.
If someone had a ton of time, it would be extremely interesting to delve deeper into the DPC voting statistics. Questions such as whether the variance is constant or dependent on the number of votes are imminently answerable, with time.
The biggest impediment to doing this type of work is that it is *very* difficult to collect the required statistics in an automated manner, and collecting them manually is too onerous for all but the smallest data sets |
|
|
|
03/20/2009 02:26:57 PM · #22 |
statistics do lie - but only when they are chopped up and used to such an end. i don't think the DPC method of averaging votes is chopped up or twisted in any way. i could be wrong - but i doubt that allowing a scale of 1-1000 would significantly affect the outcome of the placement of images.
a three tiered scale might...
|
|
|
|
03/20/2009 02:22:43 PM · #23 |
if posthumous is against the voting method here at DPC - he can go vote on the 5 star scale over at flickr. my guess. he'd vote the images he found he liked 5 stars- and the ones he didn't 1 star. that method would end up in a completely anti-gaussian distribution, and he'd be touting how gret that system is in this thread...
end /// sarcasm
|
|
|
|
03/20/2009 02:21:53 PM · #24 |
Originally posted by soup:
as it stands now - i think the voting scheme is designed to give a reasonably accurate account of the overall view of the voters - while at the same time keeping it simple enough to attempt to entice people to vote. if the voting methods were too convoluted - you'd likely see less votes and actually see less accurate results - as a result. |
I agree. We are not trying to conduct scientific evaluations here. It is all about fun, and as you said the current scheme is simple enough as to not turn people off. |
|
|
|
03/20/2009 02:18:31 PM · #25 |
as it stands now - i think the voting scheme is designed to give a reasonably accurate account of the overall view of the voters - while at the same time keeping it simple enough to attempt to entice people to vote. if the voting methods were too convoluted - you'd likely see less votes and actually see less accurate results - as a result.
|
|


