| Author | Thread |
|
|
02/11/2011 04:07:31 PM · #1 |
Simulation – Voting styles and their effect
Introduction:
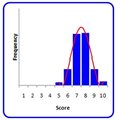
Ok, if you started with the history section you’ve seen that we spent some time exploring the average statistic as a measure of central tendency. In this section I want to introduce a measure of variation around the central point called standard deviation. As standard deviation increases the spread of the distribution increases; here are some examples:
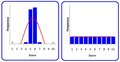
Each of these distributions has approximately the same average of 5.5000. However the variation within each distribution is very different. The fist distribution uses only the center of the possible scores resulting in a standard deviation of about 0.5. The second distribution uses all possible scores equally which results in a standard deviation of almost 3.0. So a voter’s average alone never tells you the whole story.
Voter distributions:
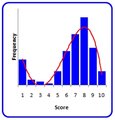
Here are a few voter distributions that we might see. Each chart shows the distribution of a voter’s votes across 150 images in a challenge. Some distributions are common and some are rare:
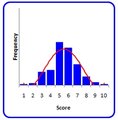
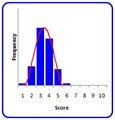
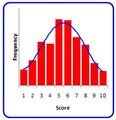
Mean: ~5.5000
Std Dev: ~1.5
I’d call this the distribution of a “Typical Voter”. There’s a strong tendency toward the central part of the scale but they’re not opposed to using the ends when they are moved to do so. Some typical voters may give a few more high votes than low or a few more low votes than high so I suspect that the mean will swing from 5 to 6 but the shape of the curve is generally the same. The distribution of a “Typical Voter” approximates the shape of a normal curve.
“I think it's most fun to use the full spectrum of scores, and that includes 1s. I don't use them nearly enough. Any photo worth its salt should engender a wide variety of reactions, from 1s to 10s. Let's all stretch our keypads to the limit!” – DPC user quote
“As it turns out, my voting tends to follow a bell curve. It's not intentional, but that's they way it turns out. I use the whole scale too, in general, when all is said and done I've got about as many ones as tens” – DPC user quote
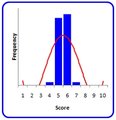
Mean: ~5.5
Std Dev: ~0.5
The distribution of the “Centrist”; the voter who is so bound by central bias that they can’t bring themselves to use the extremes of the voting scale. I concede that this is pretty rare but I can tell you in 2010 I did some experimenting with my own voting and devised a method based on a weighted average of five factors. I found that more often then not, the average of the factors drove the final score to the center of the scale. For example the average of an image given a 7 on creativity and a 3 on technicals averages to 5. Even using five factors and weighting them differently based on the challenge criteria I found myself seldom voting less than 4 or greater than 7. This type of voting scheme can push a voter's scores to the middle of the distribution.
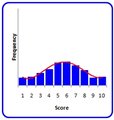
Mean: ~5.5
Std Dev: ~2.5
The distribution of the “Equalizer”; this voter still distributes a majority of their votes in the central portion of the distribution. However they feel that there are plenty of ones, twos, threes and eights, nines and tens to be found in every challenge.
"These are pretty typical of the distribution I give out for each challenge. 10's – 3, 9's – 4, 8's – 16, 7's – 21, 6's – 28, 5's – 28, 4's – 25 , 3's – 19, 2's – 6, 1's - 1" - DPC user quote
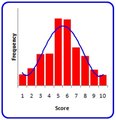
Mean: ~5.5
Std Dev: ~3.0
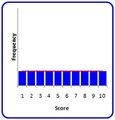
This is the distribution of the “Bucket Voter”. This voter, who is totally immune to central bias and views the scale as 10 equal buckets in which to distribute their votes. Note that this is the first of the mid-scale average distributions that doesn’t approximate a normal curve.
Ok, if you’ve read this far I now that you’re saying “not every distribution is centered on the middle of the scale”. This is true, let’s look at some with central tendencies that aren’t at the center of the scale:
Mean: ~3.5
Std Dev: ~1.0
Some call this the distribution of the nefarious Troll but I don’t see anything particularly sinister with this distribution. Yes the mean is below the voting norm but the distribution is balanced. I prefer to call this the distribution of the “Critic”. A critic can be defined as someone who expresses reasoned judgment or as someone who finds fault. I’ll let you decide which of these definitions apply. Perhaps they just haven’t been moved enough to by any images to score any higher yet.
“Few people are good at what they do; even less produce remarkable work. Masters who create the very models of seeing are infinitesimally rare. The bulk is dross. Given the nature and scope of this site, my considered, average, popular score is 3.” – DPC user quote
Mean: ~3.5
Std Dev: ~2.0
This is the distribution of the “Biased Voter” who is also a Troll in some people’s estimation. This voter has a specific threshold, lower than the middle of the scale, which an image must pass just to be considered for further critique. However for those images that do pass the threshold, the voter is willing to award a few rare high marks. This is another distribution that doesn’t approximate a normal curve because of the hard lower limit. You can’t score less than 1 so the distribution becomes skewed.
“I think it more useful to vote according to fact and perception than according to some social conformism of nicety.” – DPC user quote
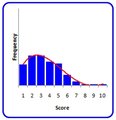
Mean: ~7.5
Std Dev: ~2.0
The “Academic” distribution; this distribution belongs to the voter who believes that a passing grade is around the 70th percentile and can’t imagine regularly scoring any image below a six unless it’s a technical mess. This distribution may also belong to the voter who generally votes high but reserves the right to blast an over-played cliché or they may be offended by the human form.
“I personally score lower for the cliché shots of wine glasses and water drops and tend to score higher for originality. however (and i know this isn't right and I actually intend to adjust it) i generally score between 5 and 8 on most challenges, I rarely score lower than a 5 and rarely higher than an 8” – DPC user quote
Mean: ~7.5
Std Dev: ~1.0
This is the distribution of the “Pollyanna”. This voter compares every image to their Aunt Edna’s snapshots not to the rest of the DPC population. They find goodness in every image they vote on. They give the photographer a minimum score of 5 just for picking-up the camera.
“I very rarely give out a vote of less than 5 these days... I try and see all the good things in the photograph rather than the bad…”– DPC user quote
Ok, this list of voter distributions may not be comprehensive. For example the extreme distributions with no variation like all 1 votes or all 10 votes aren’t shown because they are likely to be picked up by the vote scrubber. The distributions shown do cover a range of peaked versus flat and low versus middle and high. What do you think happens when you mix them all together? If you’ve stayed with me this far don’t quit now.
If you combine the data for all of the distributions above the total becomes remarkably normal once again. Yes that’s right, every Troll is balanced by a Pollyanna; every Academic is balanced by a Biased Voter and the voters with a middle scale central tendency build the peak of the nearly normal curve.
If you take the liberty of saying that for every extreme voter there are probably two with tendency to vote toward the middle of the distribution with a 0.5, 1.5 or 2.5 standard deviation we’re back to a mean of 5.5 and a standard deviation less than 2.0. Pretty close to the distribution of the “Typical Voter”.
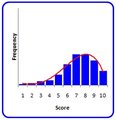
Yes, this is a controlled experiment and the results are predictable but take the time to look at the typical distribution of images in the challenge results you’ll rarely see final image distributions that don’t approximate the normal curve. The ones that are not normal are either bound by the upper and lower limits of the scale causing them to be skewed or they are bi-modal, for example:
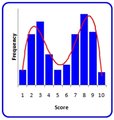
This is an extreme bi-modal distribution. It’s called bi-modal because it has two distinct peaks instead of one. You could hypothesize if we had two dissimilar voting groups, perhaps Critics and Pollyannas, an image might score a distribution like this. It's unlikely that you'll see this strong of a bi-modal distribution in DPC voting.
You're more likely to see a bi-modal image distribution like this. It’s not as extreme as the one above. In statistical terms you could say that a “special cause” has occurred to create the small lower peak. Perhaps the cluster of low votes comes from some easily offended voters confronted with a nude image. Maybe the image is well executed cliché shot with a handful of cliché hating voters expressing their disdain.
“The only one that I know of for sure is scantily clad women. I feel like a lot of people enter those photos hoping to get a good score just because the model is attractive, and that bugs me. Unless it is a super well done photo or 'classy' in some way I tend to vote them down pretty badly. I don't even do it on purpose, it’s just a reaction. I know I definitely give them lower scores than the quality of the photograph probably deserves” – DPC user quote
Mathematically there is no question that the votes clustered in the lower mode of this distribution have affected the average of this image. However, in my opinion, it's difficult to say that the affect is unfair. These voters are entitled to their reaction. When it comes to polarizing subject matter both extremely high and extremely low votes should be expected.
A few points to consider:
Now I’ll stop offering theory and move straight into opinion. I think we spend far too much energy worrying about the way people vote. Can an extreme voter impact the finishing position of an image? Yes, but I believe marginally at most. The distributions show that extreme votes are usually balanced on the opposite side of the curve.
Most average scores approximate normal curves. High average scores are skewed to the high side because you can’t score more than 10 and the low average scores are skewed similarly toward the low side. This is perfectly normal for a Likert scale.
The lower targeting voters like the Critic and Biased Voter are not Trolls simply because the use the voting scale differently than the average voter. They are entitled to use their style just like the Academic and the Pollyanna that nobody complains about. Every voice in the choir deserves to be heard.
I think it’s normal for a voter’s distribution to shift subtlety from challenge to challenge and even more so as they become experienced. I believe the best voters are the ones that find a meaning in their interpretation of the scale over time and remain true to that interpretation whether they are targeted low, central or high.
I’ve intentionally left one distribution out of this discussion but I haven’t forgotten it; the dreaded inverted distribution voter. The voter who votes a 10 for images that he really thinks are deserving of a 1 and votes 1 for those that should be 10 etc. to avoid scrubber detection. If this voter really exists, and I have my doubts, his despicable actions can easily be detected. I'll take this subject on in a different section.
Some would say that we should post a user's voting distribution along with their average. Although the number's geek in me thinks that this would be interesting, I'm afraid that the DPC community isn't ready for it. There simply isn't enough understanding and acceptance for the more unique voting styles. When ignorance prevails, unfair persecution will begin; kind of like the community of Salem Massachusetts in 1692.
For those who are interested; these examples were created using a vote simulator that produces 150 random votes between 1 and 10 based on a selected target mean and standard deviation. This was accomplished in Excel using the NORMSINV and RAND functions. If you have any interest in dissecting or experimenting with the simulator you can download it at the bottom of the page at this link:
Link to Voting Stats site
|
|
|
|
02/11/2011 04:13:08 PM · #2 |
Now, THIS one ought to generate some responses :-) Have at it, people!
R. |
|
|
|
02/11/2011 04:18:42 PM · #3 |
|
Wonderful breakdown -- from a "typical voter". |
|
|
|
02/11/2011 05:09:20 PM · #4 |
|
Once upon a time, we wanted to look at the DPL's effect on voting. We asked Langdon to dump all the votes cast over a particular time period several months in length. The resulting data file contained over a million votes. I personally did a bunch of evaluation on voting patterns using this data. Now *that* was an interesting data set! |
|
|
|
02/11/2011 05:16:31 PM · #5 |
I'm not sure of the relevance of these stats. When you look at the distributions of the votes received in an image, the values are normally distributed. Cases of exceptionally good or bad photos (first, last place) may not be normally distributed primarily due to the bounds (1, 10).
Therefore this means:
1) There are a lot of votes cast (see my prior info on CLT, etc.)
2) DPC has done a great job of making sure the 20 % voting and random orders are fulfilled to aid in the randomness of voting.
3) An individuals personal style of voting does not matter.
Thus, I caution reading too much into these plots. |
|
|
|
02/11/2011 05:26:53 PM · #6 |
Loved reading this, and it very much echos what I have been thinking (that there really aren't that many trolls, and the few that there are don't affect the score as much as people think).
Kudos for putting so much work into this, and also your other statistics posts recently.
They are very interesting.
I like this one the best. :-) |
|
|
|
02/11/2011 06:31:59 PM · #7 |
Originally posted by PGerst:
...Thus, I caution reading too much into these plots. |
I tend to agree. Most (real) voters follow a relatively Guaussian pattern, some with a wider variance than others. That part is interesting. Some of the "derivative statistics" are interesting as well, such as the distribution of a voter's deviations from the final scores for images they voted on. But this kind of data is not accessible to us, nor even to the SC, normally. |
|
|
|
02/11/2011 06:34:22 PM · #8 |
Originally posted by kirbic:
Once upon a time, we wanted to look at the DPL's effect on voting. We asked Langdon to dump all the votes cast over a particular time period several months in length. The resulting data file contained over a million votes. I personally did a bunch of evaluation on voting patterns using this data. Now *that* was an interesting data set! |
Hey Kirbic, do you think Langdon would release a couple challenges worth of time-stamped (chronological) votes? I think it would be fascinating to see what patterns exist (if any, I suspect it's actually pretty random) in voting over the course of a challenge's voting period. I'm not interested in who's image it is or who voted just the chronological value.
eta:spelling
Message edited by author 2011-02-11 18:37:14. |
|
|
|
02/11/2011 06:46:36 PM · #9 |
Originally posted by kirbic:
Originally posted by PGerst:
...Thus, I caution reading too much into these plots. |
I tend to agree.... |
I hope no one reads too much into anything I'm saying actually :-)
As I said already, these plots are just a simulation of the "possible" distributions of some voters. The real point is that when all of our voting styles are combined they distributions generally approximate the normal curve. And even more importantly every voter is entitled to their own style. We get far too hung-up on the low voters simply because they dont fit the norm yet we never get excited about the high voters that balance them. |
|
|
|
02/11/2011 07:28:30 PM · #10 |
|
I am constantly amazed by the amount of time and thought we put into DPC. I hate numbers, and am not all that bothered by "trolls" and voting patterns (although definitely puzzled by them). thanks for all your work. |
|
|
|
02/11/2011 09:10:36 PM · #11 |
Originally posted by DJWoodward:
Hey Kirbic, do you think Langdon would release a couple challenges worth of time-stamped (chronological) votes? I think it would be fascinating to see what patterns exist (if any, I suspect it's actually pretty random) in voting over the course of a challenge's voting period. I'm not interested in who's image it is or who voted just the chronological value.
eta:spelling |
You could ask, worst he can say is no! I looked at the old data again, and there is no time stamp info on the votes. Not even any image IDs, just image score, vote and user ID, plus some boolean flags related to DPL participation. As I recall we dumped as few fields as possible, we were looking to perform very specific tests.
I don't even know whether the time stamp information is retained in the vote tables, to be honest. |
|
|
|
02/11/2011 09:15:16 PM · #12 |
FWIW, here are my "delta-v" histograms for the time period just before, during and after the first DPL season in 2007:
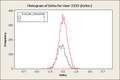
The "delta" is the difference between my vote and the final score of the image. I did this exercise for a number of voters, and the results were really interesting. I can't, of course, publish any one else's data, for obvious reasons. |
|
|
|
02/11/2011 09:40:42 PM · #13 |
Now this is getting to the core....no wonder how you find friend votes, etc. :) But, this just goes to show, the meat is in the individual data. The SC has all the fun data. :)
Originally posted by kirbic:
FWIW, here are my "delta-v" histograms for the time period just before, during and after the first DPL season in 2007:
The "delta" is the difference between my vote and the final score of the image. I did this exercise for a number of voters, and the results were really interesting. I can't, of course, publish any one else's data, for obvious reasons. |
|
|
|
|
02/11/2011 11:44:59 PM · #14 |
Del, these are interesting and entertaining posts (that second quality in particular is a tribute to your rare communications skills). Thank you.
As one commenter remarked, you prove that an individual's personal voting style does not matter. I think there is legitimacy in any considered personal voting style.
My own voting approach is eccentric by most people's standards, but it's consistent, and you reassure me that it doesn't matter anyway. I don't use all the numbers, and don't in any case consider them to have any fixed relative value. I'm deeply interested in photographs, but I have little interest in photography, and my judgements in voting reflect that.
I first give all photos that I feel are of no consequence a 3, the rest a 5.
Then I sift the 5s and identify the ones that capture my interest for longest (for any reason at all), and make those 7s.
Then I sift the 7s and find my favourite few, and these become 8s, 9s and 10s.
Then I comment on whatever I feel like.
This would I know result in a weird distribution, but they're my votes and that's what they mean to me. You're welcome to graph them, although you may think it pointless with such a small sample.
Here's my numbers for the two challenges in voting now that I have voted on:
Movie: 10=1, 9=1, 8=1, 7=3, 6=0, 5=16, 4=0, 3=25, 2=0, 1=0. Ave 4.3191
Lines: 10=1, 9=1, 8=2, 7=5, 6=0, 5=54, 4=0, 3=58, 2=0, 1=0. Ave 4.2479
|
|
|
|
02/12/2011 01:43:32 AM · #15 |
|
Good grief man, can we make this a sticky?? |
|
|
|
02/12/2011 10:21:51 AM · #16 |
Originally posted by ubique:
My own voting approach is eccentric by most people's standards, but it's consistent, and you reassure me that it doesn't matter anyway.... This would I know result in a weird distribution, but they're my votes and that's what they mean to me. |
First, thanks for sharing your unique approach. Your distribution would look something like this:
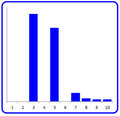
If I felt compelled to box you into the voting styles in the original post I’d say you were a combination of a “biased voter” and a modified “bucket voter” :-)
However the whole point of my message is that you shouldn’t be boxed in. There are far more voting styles than I could illustrate I’m sure.
You say I reassure you that your style doesn’t matter and I know what you mean by that. But I would be disappointed if I took your comment literally. What I hope to show is that your style does matter and that you are entitled to it. It matters just as much as a “typical voter” and just as much as a “pollyanna”.
Keep on voting your considered and valid way. I hope to someday have an image that will fall in to the upper portion of your distribution.
Message edited by author 2011-02-12 10:24:44. |
|
|
|
02/12/2011 11:09:07 AM · #17 |
|
Thanks. I reckon I'm just a benevolent Pollyanna with an aversion to even numerals. |
|
|
|
02/12/2011 01:38:38 PM · #18 |
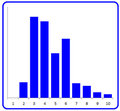
since I was one of your anonymous quotes up there, I'll add two of my curves to the mix. In spite of my call for full spectrum, I rarely can bring myself to vote 1.
(I've been influenced by  ubique's method, but I am too flighty to throw 3s at everything. I will bump up for little things that I feel add to the picture, or bump down for things I find particularly egregious. Pictures that have that something special will get a 7 and then get bumped up as I pick my own ribbons and so forth.) ubique's method, but I am too flighty to throw 3s at everything. I will bump up for little things that I feel add to the picture, or bump down for things I find particularly egregious. Pictures that have that something special will get a 7 and then get bumped up as I pick my own ribbons and so forth.)
movies
10: 1
9: 2
8: 2
7: 2
6: 7
5: 6
4: 9
3: 8
2: 8
1: 0
free study
10: 3
9: 4
8: 11
7: 14
6: 58
5: 43
4: 75
3: 81
2: 9
1: 0 |
|
|
|
02/12/2011 04:02:10 PM · #19 |
Originally posted by posthumous:
since I was one of your anonymous quotes up there, I'll add two of my curves to the mix.... |
The posthumous voting curve (based on a very limited sample of course, as was ubique's).
Thank you for sharing! |
|
Home -
Challenges -
Community -
League -
Photos -
Cameras -
Lenses -
Learn -
Help -
Terms of Use -
Privacy -
Top ^
DPChallenge, and website content and design, Copyright © 2001-2026 Challenging Technologies, LLC.
All digital photo copyrights belong to the photographers and may not be used without permission.
Current Server Time: 07/22/2026 03:25:27 AM EDT.


