| Author | Thread |
|
|
06/28/2010 05:07:26 PM · #26 |
Originally posted by NiallOTuama:
But there are like 13 pages of results! |
Sent you an email. |
|
|
|
06/28/2010 06:01:38 PM · #27 |
How's this for lack of progress... :-P |
|
|
|
06/28/2010 06:03:56 PM · #28 |
I did some maths and stats, and have concluded a good way of seeing your trend is to multiply your percentile finishing by your score for that competition
(Prash, I replied. If you want to it might be interesting to upload that chart and put it next to the scores over time one.)
|
|
|
|
06/28/2010 06:12:38 PM · #29 |
Originally posted by kirbic:
How's this for lack of progress... :-P |
I like to think of it as `consistant`. |
|
|
|
06/28/2010 06:15:15 PM · #30 |
Originally posted by kirbic:
How's this for lack of progress... :-P |
That looks sooo cool!!! Beware.. it looks like Google's stock performance chart before they took off;-) |
|
|
|
06/28/2010 06:18:36 PM · #31 |
Originally posted by NiallOTuama:
I did some maths and stats, and have concluded a good way of seeing your trend is to multiply your percentile finishing by your score for that competition
(Prash, I replied. If you want to it might be interesting to upload that chart and put it next to the scores over time one.) |
This is what he prepared:
Thanks man! |
|
|
|
06/28/2010 06:32:27 PM · #32 |
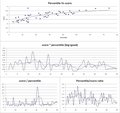
kirbic, hope you don't mind* but I did the same with your scores.
I'm very interested in the percentile vs score plot. I think it makes sense, but it trends up in yours, as it didn't with Prash's, over the percentile of 80.
* if you do mind PM me and I'll take it down.
|
|
|
|
06/28/2010 06:58:23 PM · #33 |
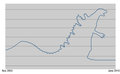
I started off ok, shot up, became extremely erratic, nosedived and then flatlined. |
|
|
|
06/28/2010 07:10:05 PM · #34 |
Originally posted by NiallOTuama:
kirbic, hope you don't mind* but I did the same with your scores.
I'm very interested in the percentile vs score plot. I think it makes sense, but it trends up in yours, as it didn't with Prash's, over the percentile of 80.
* if you do mind PM me and I'll take it down. |
Don't mind at all! I'm still trying to get my mind around what it is (or isn't) telling me :-) |
|
|
|
06/28/2010 07:21:56 PM · #35 |
>> I'm still trying to get my mind around what it is (or isn't) telling me :-)
Hard to know if they mean anything, really. :)
|
|
|
|
06/28/2010 07:25:01 PM · #36 |
Originally posted by Prash:
Beware.. it looks like Google's stock performance chart before they took off;-) |
As long as it doesn't look like GE's chart before they crashed! |
|
|
|
06/28/2010 07:46:34 PM · #37 |
So, you want a DPC statistician? Ok. What do you want to know?
I took a multivariate approach to my scores. Final result: I'm getting better with experience.
But, if you'd like to know more, I'll take a gander at your scores. If there is something specific you'd like to know, I can tune in on it better.
Paul |
|
|
|
06/28/2010 07:57:36 PM · #38 |
Originally posted by PGerst:
So, you want a DPC statistician? Ok. What do you want to know?
I took a multivariate approach to my scores. Final result: I'm getting better with experience.
But, if you'd like to know more, I'll take a gander at your scores. If there is something specific you'd like to know, I can tune in on it better.
Paul |
You can't be as good as Art. His scoring trend is monster like... |
|
|
|
06/28/2010 08:08:06 PM · #39 |
love the godzilla effect it has on you!
Originally posted by Art Roflmao:
I started off ok, shot up, became extremely erratic, nosedived and then flatlined. |
|
|
|
|
06/28/2010 08:46:25 PM · #40 |
Another way to look at it. If you use Shewart's control chart concept and Western Electrics rules for control your scores look like they have common variation around a mean of 4.9. There is no appreciable trend in the data. Without a significant change you can expect to continue to vary up and down from that mean.
 |
|
|
|
06/28/2010 08:48:06 PM · #41 |
This 'Art' dude is super creative! If he is not in a creative profession, he's gotta watch this recent blockbuster '3 Idiots'. Part of this movie is about a guy following his passion of photography professionally;-)
Originally posted by reneekerr:
love the godzilla effect it has on you!
Originally posted by Art Roflmao:
I started off ok, shot up, became extremely erratic, nosedived and then flatlined. |
|
|
|
|
|
06/28/2010 08:55:22 PM · #42 |
Yes, quite. After performing principal component analysis I have identified 3 components, attributed to
1) Tall buildings (14.95 %)
2) Bananas (2.4 %)
3) Cameos in DPC photos (82.65 %)
Originally posted by bassbone:
You can't be as good as Art. His scoring trend is monster like... |
|
|
|
|
06/28/2010 08:55:58 PM · #43 |
Originally posted by PGerst:
Yes, quite. After performing principal component analysis I have identified 3 components, attributed to
1) Tall buildings (14.95 %)
2) Bananas (2.4 %)
3) Cameos in DPC photos (82.65 %)
Originally posted by bassbone:
You can't be as good as Art. His scoring trend is monster like... |
|
;-);-)
|
|
|
|
06/29/2010 06:09:54 AM · #44 |
>> After performing principal component analysis I have identified 3 components
Hah. For a second I thought you said you did ICA and for a split second thought you isolated each voter, and was like "whoah!"
|
|
|
|
06/29/2010 10:53:04 AM · #45 |
Great idea Prash! It was interesting to chart it. I guess I need to enter more challenges. From the looks of mine...I'd say I'm extremely consistent :/
 |
|
|
|
06/29/2010 11:08:40 AM · #46 |
That was a fun exercise! It is interesting that my overall "comments received" trendline is down, but just looking at the previous 50 it trended up (same for scores to a lesser degree). I wonder if that was DPL influence...
Previous 50
Scores

Comments

Lifetime
Scores

Comments

|
|
|
|
06/29/2010 12:28:30 PM · #47 |
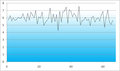
Anyone care to make observations?
Clearly there has been some improvement...

ETA:
I think I need to work on my consistency.. I'm all over the place with regards to placement..
Message edited by author 2010-06-29 12:45:29. |
|
|
|
06/29/2010 12:30:23 PM · #48 |
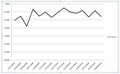
here my simple chart...
can you help me to read it? ;-)
 |
|
|
|
06/29/2010 12:44:40 PM · #49 |
Originally posted by GiorgioBaruffi:
here my simple chart...
can you help me to read it? ;-)
|
I see a def improvement, an upward trend. You are on the right track:-) |
|
|
|
06/29/2010 12:45:23 PM · #50 |
Originally posted by coryboehne:
Anyone care to make observations?
Clearly there has been some improvement...
|
Your score seems to be juggling around, but I am happy to see the %ile score on a generally upward rise:-)
Keep it up... |
|
Home -
Challenges -
Community -
League -
Photos -
Cameras -
Lenses -
Learn -
Help -
Terms of Use -
Privacy -
Top ^
DPChallenge, and website content and design, Copyright © 2001-2025 Challenging Technologies, LLC.
All digital photo copyrights belong to the photographers and may not be used without permission.
Current Server Time: 10/13/2025 06:32:23 AM EDT.


