| Author | Thread |
|
|
02/07/2011 10:35:53 PM · #1 |
Simulation � How long does it take for an average to stabilize
Introduction:
As voting begins many of us can't wait to click on the update button. We see the first few votes and then the roller coaster ride begins. How long does it take until the average score stabilizes?
Moving Average:
To examine this question I have a vote simulator. It produces 150 random votes between 1 and 10 targeted to a given mean and standard deviation. One of the statistics that the simulator calculates is called moving average. Moving average is simply the progressive average as the votes come in, for example data point two is the average of votes one and two, data point three is the average of votes one, two and three, etc. Think of it as the averages you could record if you hit the update button between each vote cast.
In chart form, a typical moving average of votes would look like this:
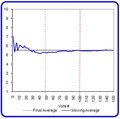
The X axis is the number of votes cast and the Y axis is the moving average.
The following images are from eight random cycles of the simulation:
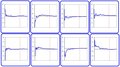
They show that invariably the moving average swings wildly in the beginning of the voting, but in most cases by the 100th vote, indicated by the red vertical line, the moving average has come very close to the final average, indicated by the gray horizontal line. Some averages start low and progressively improve, some start high and progressively get lower and some jump to either side of the average before settling to the final number.
For the following data I repeated the simulation 150 times and averaged the results:
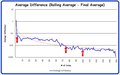
This is a little more complex, this chart shows the average of the absolute value of the difference between the rolling average and final average as votes increase. Note that the Y axis of this chart is logarithmic. With these votes created in random order with a distribution approximating the normal curve this chart tells us the following about the simulation:
On average...
The first vote is 1.2 points away from the final average
By the second vote the moving average is typically less than 0.100 points away from the final average
By the seventy-fifth vote the difference is less than 0.010 points
By the one-hundredth vote the difference is less the 0.005 points
A few points to consider:
This is only a simulation and some of the conclusions are based on the average of 150 repetitions. The pattern of the moving average for any individual image may be quite different. You may see more significant swings after 100 votes in real-life, especially if the vote scrubber removes many votes at roll over.
The key thing that I hope to demonstrate here is that even with normal, randomly generated values, significant swings above and below the final average can be seen until a sufficient number of votes are cast. It doesn't take a Troll or a group of late night low voters to make you feel that your average is plummeting. Perhaps the average was artificially high in the early votes.
If the total number of votes cast for an image drops significantly less then 100 then we might need to more concerned about the impact of a single vote.
The Simulator:
If you have any interest, this is what the vote simulator looks like in Excel:
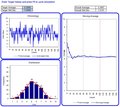
The chronology chart, upper left, shows the order in which the simulated votes are cast. The distribution chart, lower left, depicts the frequency distribution of the same votes. The chart on the right shows the moving average of the votes. The data is generated using the NORMSINV and RAND functions. If you have any interest in dissecting or experimenting with the simulator you can download it at the bottom of the page at this link:
Link to Voting Stats site
|
|
|
|
02/07/2011 11:05:35 PM · #2 |
Nice job on the simulator... what are you typically using for the standard deviation in your simulations? I find that the majority of distributions for individual images are relatively normal, however that's not always the case. In addition, for those images with normal vote distributions, the standard deviations vary quite a bit. Finally, for images that *would* have normal distributions but for which the tail of the distribution would fall outside of the voting scale, the tail is not truncated, as you'd assume, but the values are "pushed in" and stack up at the extreme value of the scale. This makes it difficult to calculate the standard deviation of the underlying distribution... difficult, but not impossible.
Message edited by author 2011-02-07 23:16:37. |
|
|
|
02/08/2011 06:28:08 AM · #3 |
Thanks, for the most part I've been using ~1.5. Quite some time ago I did a little analysis of a couple full "average" challenges and found that the Std Dev seem to run ~1.3 to 1.5. That on top of some simulator trial and error to get some typical curves.
I'm the first to admit that this isn't an exact science; at least not for me :-). I know we have anecdotal evidence that indicates we have some wild swings on individual images even late in a challenge but I can't help believe that they are the exception not the norm. I'd love to capture time sequenced vote values for a few images like that but I suspect it would be hard to acquire enough data. |
|
|
|
02/08/2011 07:47:04 AM · #4 |
| I think 1.5 is as good a constant value as you could have chosen... I've seen values up to around 2 or a little higher, and down to about 1.2. One thing you might think about implementing is randomizing the standard deviation, between the above numbers. |
|
|
|
02/08/2011 08:54:05 AM · #5 |
Nice graphs. What you are describing here is the central limit theorem. It essentially states that as you obtain a higher number of observations the distribution starts to take the proper shape. Once the distribution has taken shape the mean will "stabilize".
As to when the mean stabilizes is dependent on two things: the actual population standard deviation and the square root of the number of observations.
The usefulness of knowing when it stabilizes is limited. A more practical use of the individual values is to predict what the final score will be. If one is tracking the votes the receive its possible to get a confidence interval for what their score will be over the next N number of votes. |
|
|
|
02/08/2011 09:23:39 AM · #6 |
In my challenge monitor I have to generate some filler votes sometimes if I miss a vote or a few. I use the current average with a standard deviation of 1.5--I did some independent analysis when I first wrote the program and got that number too. It's nice when numbers match :)
I do wonder if 100 might be a best case scenario, though. With the standard deviation over the small voting range of the numbers are bound to average out around the 100 mark. The worst case scenario might be when every vote is equally likely.
In the spirit of things I ran a simulation of my own. 1000 runs of 250 votes with a uniform probability of 1, 2, 3 to 10.

And with 1000 runs with 2500 votes

Because there is no normalisation model it takes a lot longer to settle, and the final settling value isn't as level as you'd like it to be either (i.e. it's at 5.5 plus and minus a bit). But with entries that have a wider or (in this worst-case) uniform voting pattern(what may be more posthumous ribbon candidates?) there is far more uncertainty about what the numbers mean. A good example of this kind of shot would be from the recent sentinel challenge:

|
|
|
|
02/08/2011 10:27:55 AM · #7 |
| Good point... we need to be reminded that a lot of the conclusions we may draw rely on the distribution of votes on a particular image being normal. They sometimes are not. If we talk about overall voting patterns across a large number of images, the voting pattern will be very nearly normal. It will probably tend to have "heavy tails," however, which throws a wrench in the works for some calculations, but doesn't substantially affect others. |
|
|
|
02/08/2011 10:31:39 AM · #8 |
This is a fun study and gives people a good feel for the way things bounce around. A rule of thumb is that the error in your estimate of the final mean is
S/sqrt(N)
S is the standard deviation and N is the number of votes. This is called the standard error.
We can get a pretty good estimate of that from a image near the site average with a lot of votes. Let's take
 (to pick on one of my wife's shots). The numbers this set of votes are (to pick on one of my wife's shots). The numbers this set of votes are
488 votes
5.74 average
1.32 standard deviation
0.06 standard error
You interpret this "0.06" how far the average might drift from then until you got to an infinite number of votes. This is the red curve on . It is more than the bounce you see from vote to vote, but it lets you know how much to trust a current average. Estimates of the error vs number of votes looks like this.
votes standard error
1 1.32
10 0.42
25 0.26
50 0.19
75 0.15
100 0.13
150 0.11
200 0.09
The details, of course, depend on the underlying model. As  kirbic points out you don't always get a normal (Gaussian) distribution in the voting pattern due to the limits of the voting range or peculiarities of the vote distribution. This really breaks down if, for example, there are two classes of decisions by votes. In an extreme case there could be one group that think "DNMC" and give an average of 3 while the rest think it is a pretty shot and give it an average of 7. In that case the effective standard deviation of the distribution is much larger and it will take more votes to settle into a value near the eventual final average. kirbic points out you don't always get a normal (Gaussian) distribution in the voting pattern due to the limits of the voting range or peculiarities of the vote distribution. This really breaks down if, for example, there are two classes of decisions by votes. In an extreme case there could be one group that think "DNMC" and give an average of 3 while the rest think it is a pretty shot and give it an average of 7. In that case the effective standard deviation of the distribution is much larger and it will take more votes to settle into a value near the eventual final average.
The central limit theorem (CLT) says that for a system with a large number of variables that contribute to the voting value that you should get a normal distribution. If the distribution is narrow enough and away from the limits (like your example) then the mean and standard deviate are good ways to characterize the sample.
Note: to really play this stat's game with abandon it would be really great if the site computed the standard deviation of voting for each picture rather than just the mean (e.g. in the challenge history).
|
|
|
|
02/08/2011 11:34:07 AM · #9 |
Originally posted by kirbic:
I think 1.5 is as good a constant value as you could have chosen... I've seen values up to around 2 or a little higher, and down to about 1.2. One thing you might think about implementing is randomizing the standard deviation, between the above numbers. |
Ha! I was thinking that exactly after reading your question. I may try that on the advanced simulator file |
|
|
|
02/08/2011 11:40:41 AM · #10 |
| Thanks for the input from everybody else! Very interesting stuff. |
|
|
|
02/08/2011 01:51:10 PM · #11 |
Originally posted by jkn:
Note: to really play this stat's game with abandon it would be really great if the site computed the standard deviation of voting for each picture rather than just the mean (e.g. in the challenge history). |
Well, what we *do* have is the histogram of votes given. We can't calculate sigma directly, but there is s slick way to do it.
- In a spreadsheet, list the integers from 1 to 10 in column A.
- In column B, list the number of votes given on a particular image for the corresponding score in Column A.
- In Column C, calculate the cumulative probability for each score by dividing the total votes for that score and all lower scores by the overall vote total.
- In column D, calculate the Z value of the cumulative probability, but only if the probability was greater than 0 and less than 1. The formula should look like:
=IF(C4>0,IF(C4<1,NORMSINV(C4),""),"")
- In column E, take the value from Column A and add 0.5
- Plot the Column E values on the X axis of a scatter plot, with the Column D values on the Y axis.
What you plotted is a cumulative probability plot for which a normally-distributed data set will plot in a straight line. Here's the cool things:
- The X intercept of this line is an estimate of the mean of the underlying distribution (1)
- The slope of this line is an estimate of the standard deviation of the underlying distribution (2)
- The r-squared value is an indication of the goodness of fit to the normal distribution
- And here is the really cool part... this technique still works, even if the distribution is pushed up against the limit of the rating system! This works because the distribution is not truncated, but the votes that might have lied outside the allowed range of ratings will "pile up" in the highest (or lowest) rating, in our case 10 or 1.
(1) The intercept will not be exactly the same as the mean score, especially if the distribution overruns the rating scale. In this case, a simple average is a *less* accurate measure of the true underlying mean of the distribution than the intercept of the plot!
(2) The slope will not be the exactly the same as the standard deviation of the vote data, for the same reasons stated in (1), but is also a more accurate measure when the distribution overruns the rating scale.
Message edited by author 2011-02-08 13:54:45. |
|
|
|
02/08/2011 04:32:41 PM · #12 |
Kirbic, I gave it try, very neat and quite elegant.
I just use a little brute force. I have a spreadsheet that I copy the histogram data into and it converts the counts into "real" votes. Then I run the descriptive statistics :-)
 |
|
|
|
02/08/2011 05:25:17 PM · #13 |
Originally posted by DJWoodward:
I just use a little brute force. I have a spreadsheet that I copy the histogram data into and it converts the counts into "real" votes. Then I run the descriptive statistics :-)
|
Yep, that's the other angle of attack... now, take a high-scoring image and run both techniques. Notice how the statistics diverge as the distribution gets shoved up against the end of the rating range? The standard deviation, as calculated from the "reconstituted votes" will understate the broadness of the underlying distribution, and for a high-scoring image will also understate the mean.
Not that any of that really matters for DPC purposes, because the score is defined as the average of all votes, but it is interesting to be able to figure out what your average for an image *would have been* if folks were not limited by the ends of the scale!
ETA: Try running both techniques on this image:

Message edited by author 2011-02-08 17:48:40. |
|
|
|
02/08/2011 07:35:20 PM · #14 |
One thing to keep in mind that there is an assumption of normality (continuous), so using certain statistics for predictions and understanding that can be bounded need to follow different rules. Though for the majority of images and votings here, the assumptions are valid.
Originally posted by kirbic:
Yep, that's the other angle of attack... now, take a high-scoring image and run both techniques. Notice how the statistics diverge as the distribution gets shoved up against the end of the rating range? The standard deviation, as calculated from the "reconstituted votes" will understate the broadness of the underlying distribution, and for a high-scoring image will also understate the mean.
Not that any of that really matters for DPC purposes, because the score is defined as the average of all votes, but it is interesting to be able to figure out what your average for an image *would have been* if folks were not limited by the ends of the scale!
|
|
|
|
|
02/08/2011 07:38:12 PM · #15 |
Originally posted by PGerst:
One thing to keep in mind that there is an assumption of normality (continuous), so using certain statistics for predictions and understanding that can be bounded need to follow different rules. Though for the majority of images and votings here, the assumptions are valid. |
Yes, indeed. Take a read through my post of 1:51 PM, the outlined method is a good way to assess the validity of the assumption of normality for a given image. |
|
|
|
02/09/2011 08:01:34 AM · #16 |
Originally posted by kirbic:
Originally posted by jkn:
to really play this stat's game with abandon it would be really great if the site computed the standard deviation of voting for each picture rather than just the mean (e.g. in the challenge history). |
Well, what we *do* have is the histogram of votes given. We can't calculate sigma directly, but there is s slick way to do it.
Originally posted by kirbic:
|
- In column B, list the number of votes given on a particular image for the corresponding score in Column A.
... |
It is a very cool trick to linearize the problem and exclude the most problematic points so a simple regression works.
My point was actually related to
Originally posted by kirbic:
type the number of votes given on a particular image for the corresponding score in Column A.
... |
It is a pain if one wants to analyze a lot of different photos (e.g. an entire free study or an entire site history) to type in 10 numbers for each one. To draw trend conclusions about site-wide tendencies it would be a prohibitive amount of typing. At least I don't have the patience. A flawed statistic (stdev) computed for you would be simple to implement for the site and enough to look at trends and tendencies.
|
|
|
|
02/09/2011 08:08:17 AM · #17 |
I'd be curious if someone could take these data sets and calculate after how many votes the mean is no longer statistically significantly (p <0.05) different from the final average at the end of the voting process.
Message edited by author 2011-02-09 08:08:55. |
|
|
|
02/09/2011 09:46:43 AM · #18 |
Originally posted by gcoulson:
I'd be curious if someone could take these data sets and calculate after how many votes the mean is no longer statistically significantly (p <0.05) different from the final average at the end of the voting process. |
It can be done, but the result depends on the number of votes and whether the underlying distribution is Gaussian (normal). In other words, if you are tracking the votes received for an image, you can estimate your "confidence level" for whether the final score will fall within some chosen range around the current score. |
|
|
|
02/09/2011 09:51:52 AM · #19 |
Originally posted by kirbic:
Originally posted by gcoulson:
I'd be curious if someone could take these data sets and calculate after how many votes the mean is no longer statistically significantly (p <0.05) different from the final average at the end of the voting process. |
It can be done, but the result depends on the number of votes and whether the underlying distribution is Gaussian (normal). In other words, if you are tracking the votes received for an image, you can estimate your "confidence level" for whether the final score will fall within some chosen range around the current score. |
For starters, assume a normal distribution, with 100 votes. I suspect anything further than 100 votes, the average is pretty much "set" and will only experience minor fluctuation. |
|
|
|
02/09/2011 10:00:58 AM · #20 |
Originally posted by gcoulson:
Originally posted by kirbic:
Originally posted by gcoulson:
I'd be curious if someone could take these data sets and calculate after how many votes the mean is no longer statistically significantly (p <0.05) different from the final average at the end of the voting process. |
It can be done, but the result depends on the number of votes and whether the underlying distribution is Gaussian (normal). In other words, if you are tracking the votes received for an image, you can estimate your "confidence level" for whether the final score will fall within some chosen range around the current score. |
For starters, assume a normal distribution, with 100 votes. I suspect anything further than 100 votes, the average is pretty much "set" and will only experience minor fluctuation. |
I thought so too. However, I've had challenges that have raised .3 after 100 votes. I even had a challenge that raised .3 after 150 votes (that was odd...)
|
|
|
|
02/09/2011 10:49:38 AM · #21 |
| I'm enjoying the statistical analysis of DPC. Keeps my left brain happy. |
|
|
|
02/09/2011 11:06:39 AM · #22 |
If we assume normality (dangerous even though ti is usually close to true) then the standard error of the mean is given by s/sqrt(n), where s is the standard deviation and n is the number of votes. The 95% confidence interval would be µ+1.96*(s/sqrt(n)) where µ is the average of the votes received, s is the standard deviation of those votes, and n is the number of votes.
Plug in the numbers for an image in voting, and you will get the 95% confidence interval. This tells you the expected range within which the final score will lie from the current average, with 95% confidence. Remember that the accuracy of this calculation is dependent on the normality of the underlying vote distribution.
ETA: for a hypothetical image with 100 votes, an average of 5.5 and a standard deviation of 1.5, the result is 5.5+0.294
Message edited by author 2011-02-09 11:10:18. |
|
|
|
02/09/2011 11:11:22 AM · #23 |
Originally posted by kirbic:
If we assume normality (dangerous even though ti is usually close to true) then the standard error of the mean is given by s/sqrt(n), where s is the standard deviation and n is the number of votes. The 95% confidence interval would be µ+1.96*(s/sqrt(n)) where µ is the average of the votes received, s is the standard deviation of those votes, and n is the number of votes.
Plug in the numbers for an image in voting, and you will get the 95% confidence interval. This tells you the expected range within which the final score will lie from the current average, with 95% confidence. Remember that the accuracy of this calculation is dependent on the normality of the underlying vote distribution.
ETA: for a hypothetical image with 100 votes, an average of 5.5 and a standard deviation of 1.5, the result is 5.5+0.15 |
Translation:
If your image has been holding pretty steady, with relatively few atypically high-or-low votes (outliers) you can be pretty confident what the final score is going to be at the 100-vote mark.
If your image seems to have a LOT of outliers, if it's hopping all over the place, you can't be that confident :-)
("So who needs stats anyway?" he asked, mischievously) |
|
|
|
02/09/2011 11:24:42 AM · #24 |
The voting process is dynamic and trends can occur at any time. Given a typical standard deviation of votes you can calculate the number of votes for which the mean will be withing a given range.
So, the question to ask is:
With how many votes will the average be within ± x.y of the current mean with 95 % confidence. So, first, you need to decide what range you want.
Originally posted by gcoulson:
I'd be curious if someone could take these data sets and calculate after how many votes the mean is no longer statistically significantly (p <0.05) different from the final average at the end of the voting process. |
|
|
|
|
02/09/2011 11:25:38 AM · #25 |
The voting process is dynamic and trends can occur at any time. Given a typical standard deviation of votes you can calculate the number of votes for which the mean will be withing a given range.
So, the question to ask is:
With how many votes will the average be within ± x.y of the current mean with 95 % confidence. So, first, you need to decide what range you want.
ETA: An equivalent question to ask is: "When can I stop hitting the update button?" :)
ETA: Looks like this was answered...sorry for the dupe.
Originally posted by gcoulson:
I'd be curious if someone could take these data sets and calculate after how many votes the mean is no longer statistically significantly (p <0.05) different from the final average at the end of the voting process. |
Message edited by author 2011-02-09 11:25:51. |
|


