| Author | Thread |
|
|
02/05/2011 10:27:06 AM · #1 |
Introduction
Voting is one subject at DPC that generates a great deal of discussion, debate and angst. Being a bit of a numbers geek, I�ve always been drawn to these discussions. I think they feed my left brain tendencies. In the last several weeks I�ve been doing some analysis of historical data and I�ve also been testing some theories via simulation.
If there�s interest in them, I have 10 different topics to release over the coming weeks. Before going any further though I want to state that I�m not a statistician and that I�m drawn to data that supports my belief that the voting system is fundamentally fair. But then again, I could be wrong :-)
If you�re still interested, here�s the first section:
History � Average and Central Tendency
This section explores what the average DPC score is and how it relates to the voting scale. The data presented, unless otherwise noted, is actual average scores of images between 2002 and 2010.
Historical average:
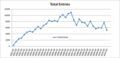
With more than 240,000 average scores to look at I decided to present it by looking at the weighted average of average scores by challenge over the course of the DPC history. Looking at this data from 2007 through 2010 the average score has been 5.4760. This chart shows the trend in that time:
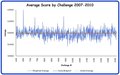
It has actually been reasonably stable and quite close to the central point of the scale. We�ll talk about the central point of the scale more later, but for now I want to look back a bit further in the history. Many members pine for the days when scores were higher. Back to a time when their images received the praise that they really deserved. It was so much easier to achieve an average score of 8 or more back then right? Let go back and see what the average score looked like from 2002 through 2005:
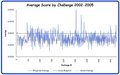
What? The average in this period was only 5.2181? It looks like the first few months were the glory days for high averages. After that they dropped quickly and they seem to have a more variation than the recent data above. So if we look at the data all together it appears that a shift occurred in late 2005 through 2006 (see the shaded area):
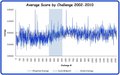
What happened in this time period? Was it the great Troll extermination of 2006? The voter population became kinder, gentler and a bit less variable after 2006. When was the vote scrubber implemented? Perhaps it had something to do with shifts in the number of voters. We'll explore that in another section later. The data shows that the grand historical average score is 5.3633.
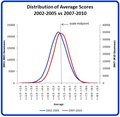
Looking at the same data in another way, here�s a histogram that shows the distribution of the average image score from 2002 through 2010. Each bar represents the number of times an average score has occurred between two values. For example the tallest bar indicates that 67,198 images have scored between 5.0 and 5.5 in this set of data. I guess we've all had some in that bucket:
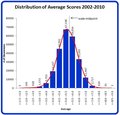
The chart shows a good example of a distribution that approximates the normal curve. It has a strong central peak and interestingly it is centered very close to the middle of the voting scale. If we break the data into 2002-2005 versus 2007-2010 segments as we did above you can see that the older data average (blue curve) is below the middle of the scale. If you could magically shift the red curve to the left you would find that it would fit within the blue curve indicating that there is less variation in the 2007-2010 data.
Central tendency:
Reading the forums it seems that some members struggle with the fact that our average score is only 5.3633. After all, a typical DPC shot is much better than the snapshots that the rest of the world takes right? Actually there are some logical reasons for our gravitation toward the center of the scale.
The voting scale we use is a form of a Likert Scale. It consists of 10 values between Bad and Good. No other definition is provided for the increments so most voters, but not all, naturally assume that they are spaced equidistantly. Likert Scales are prone to a phenomenon called Central Tendency Error which is a propensity to avoid the extreme ends of the scale. Some experts state that as the number of categories increases in the scale the central tendency also increases. Our scale has 10 categories; a typical Likert Scale only has between 3 and 6. What we see in the histogram above and the individual image distributions is exactly what we should expect.
Another factor is that the average score is after all, an average. For an image to mathematically average greater than an 8.x or less than 2.x on a scale that is bounded at 10 and 1 there has to be a tremendous uniformity amongst the voters. A very good image at DPC will be awarded with many 9 or 10 votes but can you picture any image that will elicit an 8, 9 or 10 from nearly all of 150 voters at the same time? Let's take a look at this graphically. Using a vote generator I created the following random distributions:
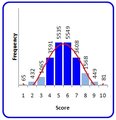
The distribution above represents 150 images being voted on by 150 voters (22,500 votes). The generator was centered on an average of ~5.5. Note that every category of the scale was used and 81% of the votes fall into the four center categories (4-7).
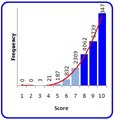
This distribution represents the same number of votes but the average is centered on ~9.0. To achieve the 9.0 average voters had to stack more votes around the mean and less of the scale was used. No score was below a 3 and 84% of the votes fell in only the highest three categories (8-10). More agreement was needed among the voters to achieve this average.
There are so many different factors considered by individuals as they vote that it�s hard to imagine that the uniformity needed could ever exist. I suspect that we will never see an average score greater than or equal to 9 simply because the mathematics of averaging will prevent it. Individual votes will occasionally use the whole scale but the average of the individual scores will not.
Psychology of scores:
The voting scale is perceived in many different ways. Some participants are comfortable with a 5.3633 average, others feel that the average score should be 7 or greater because the images of DPC are above average. Some have even called to actively attempt to raise the score by refusing to use the lower end of the scale. Try as they might, I doubt that we will ever see a major shift unless of course the scale is changed. Even if the average DPC shot is much better than Aunt Edna�s snapshots, most voters aren't considering Aunt Edna when they vote. They're considering the DPC image population and they are influenced by the 1-10 Likert Scale with its natural Central Tendency Error. It really is Ok to accept that a 5.3633 average is quite good and that an 8 is exceptional at DPC. Projecting any other meaning into the final scores scale will only make you frustrated.
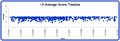
Speaking of an average of 8; how difficult is it to score an 8? Is it harder now than it used to be? Let�s take a look at the scoring timeline. This chart shows when images have scored greater than 8 between 2002 and 2010:

Scoring greater than 8 at DPC has always been difficult but you could argue that 8s have been a little more rare in recent years (fewer dots at the right of the chart). However, the next chart shows that although scoring less than 3 is more frequent than scoring greater than 8 over all, it also a little less common in recent years.
This is reflected in the average score trend charts at the beginning of this section too. Remember that there was more variability in 2002-2005 compared to 2007-2010 and the average was lower. The average scores and variation may indicate that the extremes of the scale aren't making it to the final calculation as much now as they did prior to 2006. This data also supports that the grand average is slightly lower than the midpoint of the scale instead of above the midpoint; we score less than 3 more often than greater than 8. By the way if you want the numbers, 0.02% of the images submitted have scored 8 or more and 0.21% have scored 3 or less; an order of magnitude in difference but both pretty small numbers.
Link to Voting Stats site
eta: changed charts from monthly averages to challenge averages
Message edited by author 2011-02-25 19:53:13. |
|
|
|
02/05/2011 10:37:07 AM · #2 |
|
|
|
02/05/2011 10:46:06 AM · #3 |
| Interesting reading, and great work bringing all the numbers together in such a readable form. |
|
|
|
02/05/2011 10:46:21 AM · #4 |
Heck of a read. And it's comforting to know for sure that I'm right there with the average stats!!
|
|
|
|
02/05/2011 11:03:07 AM · #5 |
Nice work... especially the discussion of the psychology of the Likert scale. I agree with your assessment in that regard. One thing I'd like to add: a lot of folks intuitively see "5" as the midpoint of the scale, even though mathematically it is 5.5. That seems to neatly explain why the observed mean vote cast is between 5.0 and 5.5. While I don't have mathematical proof of this, I do believe it is the correct explanation for why the average lies where it does.
One thing we should all keep in mind. We're talking about DPC images and DPC voters, so if an image gets an average score, it means it is average for a DPC submission, not "your average snapshot." DPC standards are rather high, and so average around here is not bad at all.
ETA:
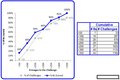
Also, with regard to the frequency of 8+ scores (and 3- scores), bear in mind that the number of entries per calendar period has been anything but constant, so even if the *probability* of achieveing such a score was constant, we should expect to see more of these scores when more images were entered. For reference, this plot:
shows the number of entries per calendar quarter from 2002 to Q3 2010. Also see this threadfor further information and discussion on site participation statistics.
Message edited by author 2011-02-05 11:19:00. |
|
|
|
02/05/2011 11:42:56 AM · #6 |
great read! thanks.
i recently added the facility to look at your own trends in my challenge monitoring program (see signature). you get nice histograms with some of our big hitters.
very interesting about the average over time. did it take 2 years to beat the trolls?
|
|
|
|
02/05/2011 11:51:32 AM · #7 |
| I think this stuff is fascinating! |
|
|
|
02/05/2011 03:24:51 PM · #8 |
Lovely stuff, Del. I'm glad you decided to publish this work. I can't wait to see the ensuing discussion as further chapters are posted up :-)
R. |
|
|
|
02/05/2011 03:41:01 PM · #9 |
| Thanks for the positive feedback so far folks. I'm glad you find it interesting. |
|
|
|
02/05/2011 03:47:04 PM · #10 |
Originally posted by kirbic:
Also, with regard to the frequency of 8+ scores (and 3- scores), bear in mind that the number of entries per calendar period has been anything but constant, so even if the *probability* of achieveing such a score was constant, we should expect to see more of these scores when more images were entered. For reference, this plot:
|
Interesting point! I'll have to look for a correlation in the raw data for this. |
|
|
|
02/06/2011 02:15:34 AM · #11 |
| Yeah, the work is definitely appreciated. I love seeing things like this broken down... very fascinating. |
|
|
|
02/06/2011 03:53:00 AM · #12 |
Originally posted by kirbic:
ETA:
Also, with regard to the frequency of 8+ scores (and 3- scores), bear in mind that the number of entries per calendar period has been anything but constant, so even if the *probability* of achieveing such a score was constant, we should expect to see more of these scores when more images were entered. |
You would think but that doesn't seem to bare out doing a quick check in the challenge history. There have been 41 photos that have scored 8 or better. Out of those 41 only 11 have come in challenges with 200 or more entries. There have been 469 such challenges to date. Now compare that to challenges that have had 123 or fewer entries. Those have seen 21 photos score 8 or better. There has only been 449 such challenges to date yet they have produced twice as many 8 scorers. That's probably because it's easier to stand out in a smaller crowd.
Message edited by author 2011-02-06 03:56:30.
|
|
|
|
02/06/2011 03:46:14 PM · #13 |
This is too cool!
When I vote, I try to vote for "this particular image's worth" as opposed to "this image compared to the others." Even so, I'm sure I am biased when one seems to stand out from the rest (in either direction). |
|
|
|
02/06/2011 03:53:58 PM · #14 |
Originally posted by yanko:
Originally posted by kirbic:
ETA:
Also, with regard to the frequency of 8+ scores (and 3- scores), bear in mind that the number of entries per calendar period has been anything but constant, so even if the *probability* of achieveing such a score was constant, we should expect to see more of these scores when more images were entered. |
You would think but that doesn't seem to bare out doing a quick check in the challenge history. There have been 41 photos that have scored 8 or better. Out of those 41 only 11 have come in challenges with 200 or more entries. There have been 469 such challenges to date. Now compare that to challenges that have had 123 or fewer entries. Those have seen 21 photos score 8 or better. There has only been 449 such challenges to date yet they have produced twice as many 8 scorers. That's probably because it's easier to stand out in a smaller crowd. |
I'm not sure that's what he meant. Or maybe it sort of is. But Kirbic was talking about number entered over the course of a year, and we'd expect to see more 8+ when there were more pictures assigned ratings, for that year. But what you're saying, is that more entries per year means more entries per challenge, and 8+ shows up in smaller challenges. So I guess that's consistent. EXCEPT: based on that idea, wouldn't we expect to see a spike on 8+ scores when we switched to exclusive opens, and cut the challenge size in half? Did we see such a spike? I have no idea...
R. |
|
|
|
02/06/2011 03:56:05 PM · #15 |
Originally posted by adigitalromance:
This is too cool! |
And you ain't seen nothing yet :-) There's another bunch of these posts to come, with different statistical aspects of scoring explored. It gets REALLY interesting post-after-next :-)
I was fortunate to be someone Del was bouncing these ideas off of. so I had a preview, so to speak. It's great stuff! But way too much information to drop in the forum all at once.
R. |
|
|
|
02/06/2011 03:57:14 PM · #16 |
Originally posted by yanko:
... challenges that have had 123 or fewer entries. Those have seen 21 photos score 8 or better. There has only been 449 such challenges to date yet they have produced twice as many 8 scorers. That's probably because it's easier to stand out in a smaller crowd. |
I suspect that some of these might have been challenges with restricted entry criteria (e.g. "Ribbon-winners only") which could skew this stat.
For that matter, I think the stats really need to be separated into Open and Member-only challenges, since both the entry and, more importantly, voting groups are different, at least for the past few years.
I don't think anyone has explicitly mentioned yet that, overall, what these stats show is that the current DPC voting system -- trolls, friend-voting and all -- represents a relatively fair, realistic, and (to me anyway) surprisingly consistent rating and ranking of the photos submitted for evaluation. |
|
|
|
02/06/2011 04:08:58 PM · #17 |
So, a few points here.
1) What do you mean by "weighted averages"? What was your weight matrix and what was it based off of?
2) There are probably other factors, but I believe 2006 was a period of time where dSLRs became better and cheaper.
3) Will you be attempting multivariate analysis techniques? Averages are nice, but only show one small piece. Techniques such as PCA (stating very generally as other techniques may be more useful) tend to be much more enlightening and can tell you how much more information you need to fully express the data set. Incorporation of data logs such as number of entries, month, challenge type, editing rules, number of comments, etc. can open a much more comprehensive analysis.
4) This extends #3. I've been thinking about this for a while, and I believe it is possible, given enough of an input set, to take a photo, run it through a model, and predict the score it will receive. The image analysis part is the tough one which is to break down the image into the proper variables: contrast, color, composition. All of these can mathematically be performed, just the task of calibration is quite a haul. :)
Anyway, just some food for thought. I'd really be interested in the multi-variate approach. I can help with that analysis if you need. I've done this on my own challenge entries; though my sample set is too small to generate a general model. |
|
|
|
02/06/2011 05:00:39 PM · #18 |
Originally posted by PGerst:
Anyway, just some food for thought. I'd really be interested in the multi-variate approach. I can help with that analysis if you need. I've done this on my own challenge entries; though my sample set is too small to generate a general model. |
Del, meet Paul. Paul, meet Del � You guys need to get together :-) If there's one thing Del has, it's a gorgeous and lovingly-compiled database... But maybe save the deeper analysis for a month or so down the road, AFTER he's published everything he's done up to this point: there's a LOT more to come.
R.
ETA: I guess I'm acting like Del's manager... Del, do you mind? Shall I shaddup? |
|
|
|
02/06/2011 05:07:53 PM · #19 |
| Wow. Excellent effort to compile all this and then present it so clearly. Thanks a lot for all the hard work and time. |
|
|
|
02/06/2011 05:45:04 PM · #20 |
| Thanks for this interesting work. I definitely look forward to the next installment. |
|
|
|
02/06/2011 05:59:11 PM · #21 |
Heh....two questions:
1) What's the motivation? Problem statement or just plain curiosity?
2) What info is in the database?
Originally posted by Bear_Music:
Del, meet Paul. Paul, meet Del � You guys need to get together :-) If there's one thing Del has, it's a gorgeous and lovingly-compiled database... But maybe save the deeper analysis for a month or so down the road, AFTER he's published everything he's done up to this point: there's a LOT more to come.
R.
ETA: I guess I'm acting like Del's manager... Del, do you mind? Shall I shaddup? |
|
|
|
|
02/06/2011 06:18:51 PM · #22 |
Originally posted by PGerst:
Heh....two questions:
1) What's the motivation? Problem statement or just plain curiosity?
2) What info is in the database? |
1. As far as I know, Del's felt for a long time that there's been a lot of irrational nonsense tossed around regarding voting, so-called trolls, effect of low votes on scores, etc etc, so he decided to see if he could drill down to the facts and draw valid conclusions. I think that's his motivation, I guess it qualifies as high-level curiosity?
2. I can't answer to that, I haven't been privy to the database itself. I know he went back a LOT of years and logged a LOT of information from the challenges, raw information, numbers, but the actual extent of it i do not know.
R. |
|
|
|
02/06/2011 07:05:24 PM · #23 |
Here a few more interesting points about the images scoring 8. They probably don't completely answer the points raised above but they are related.
Do you realize that 27% of the images scoring an 8 occurred in the first 10% of the challenges chronologically? 43% came in the first 20% of the challenges:
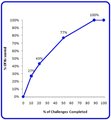
I believe that it did take some time for the �norm� to settle in at DPC and that in the early days there were few participants and I suspect that a lot more of them knew each other and were perhaps a little easy with each other.
Did you know that only 3% of the challenges through 2010 have less than 50 images but 16% percent of the 8s were in these challenges, 36% of the 8s come from challenges with less than 100 images?
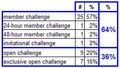
Someone asked about what �type� of challenges the 8s come from. Here�s the breakdown:
 |
|
|
|
02/06/2011 07:11:57 PM · #24 |
Originally posted by Bear_Music:
I was fortunate to be someone Del was bouncing these ideas off of. so I had a preview, so to speak. |
Yes, I want to thank  Bear_Music and DrAchoo for their feedback and encouragement! Bear_Music and DrAchoo for their feedback and encouragement!
Hey, Bear I'm happy to have you pitch in. You can be my manager but you may have to give up some of you landscapes secrets later :-)
Message edited by author 2011-02-06 19:19:24. |
|
|
|
02/06/2011 08:26:52 PM · #25 |
This is what I believe turned 2006-2007 around! I may be wrong but participation increased during the time of the WPL (now called the DPL). I don't know if the FSM or the implementation of the monthly free studies have increased the scores from 2007 to present; but I believe on or both has contributed.
Message edited by author 2011-02-06 20:34:14. |
|


